About
I am a geophysicist kept off the street by the Physics Department at California Polytechnic State University,
San Luis Obispo.
If you are a student interested in a senior project or other independent study project in geology/geophysics please use the links above to see an overview of recent research and projects.
Courses
I regularly teach the following courses in geology and geophysics (note that Cal Poly is beginning a semester curriculum in Fall 2026).
- GEOL 2206 Geologic Excursions
- GEOL 2240 Physical Geology
- GEOL 2241 Physical Geology Laboratory
- GEOL 3305 Seismology & Earth Structure
- This course will not be offered regularly on semesters and will no longer be required for the Geology Concentration.
- GEOL 4420 Field Geophysics
- PHYS 4410 Physics of Solid Earth
Projects and Research
Geophysical Research at Cal Poly San Luis Obispo
I work in, and supervise student research projects (i.e. independent study, senior projects, or just hanging around a field project), in the two primary areas outlined below.
If you are interested in one of the general topic areas outlined below, or want to get me interested in some other topic (which isn't difficult), please email me or drop by my office sometime.
Near-surface geophysics applied to hydrogeology
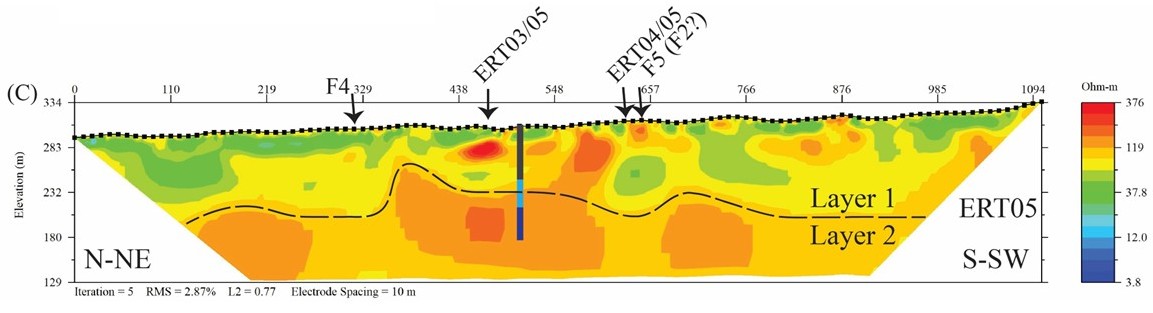
I collect near-surface geophysical data (electrical resistivity and seismic methods) to image subsurface structure with the goal of understanding the distribution and movement of groundwater - broadly speaking, hydrogeophysics.
Lately we have been working in an exposure of weathered Salinian Block granite in Paso Robles, CA. We successfully interpreted a number of electrical resistivity tomography profiles that were collected to detect where the permeable fractured granite exists.
Based on our interpretations the landowner drilled an exploratory groundwater well yielding almost 50 gallons per minute, which is on the high side in such terrains.
Work at this field site is ongoing. Aside from the geophysical imaging, related upcoming projects will include:
- Isotopic groundwater age dating in the permeable fractured granite to understand the mangagement of the grounwater resource in the permeable fractured granite
- Recharge studies:
- through the weatered saprolitic layer
- across the Rinconada Fault which separates the Salinina Block granite from uplifted and folded Monterey Formation and Vaqueros Sandstone
It may also be possible to make estimates of hydraulic parameters (e.g. hydraulic conductivity) using electrical resistivity and induced polarization imaging (Revil and Florsch 2010).
References
Revil, A., and N. Florsch, 2010, Determination of permeability from spectral induced polarization in granular media, Geophysical Journal International, doi: 10.1111/j.1365-246X.2010.04573.x.
Global Seismology
Global seismology analyzes earthquake waves to infer/constrain the earth’s deep interior structure and state.
Core Rigidity Zones
Recently students have been exploring core rigidity zones (CRZ) just beneath earth’s core-mantle boundary ScP seismic phases.
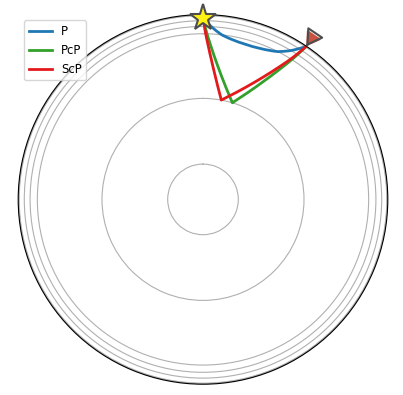
The image below shows a stack (linear and phase-weighted) of P-waves and ScP-waves. The ScP response is suggestive of a core-rigidity zone (CRZ) structure (Rost and Revenaugh 2001), or → direct link to PDF.
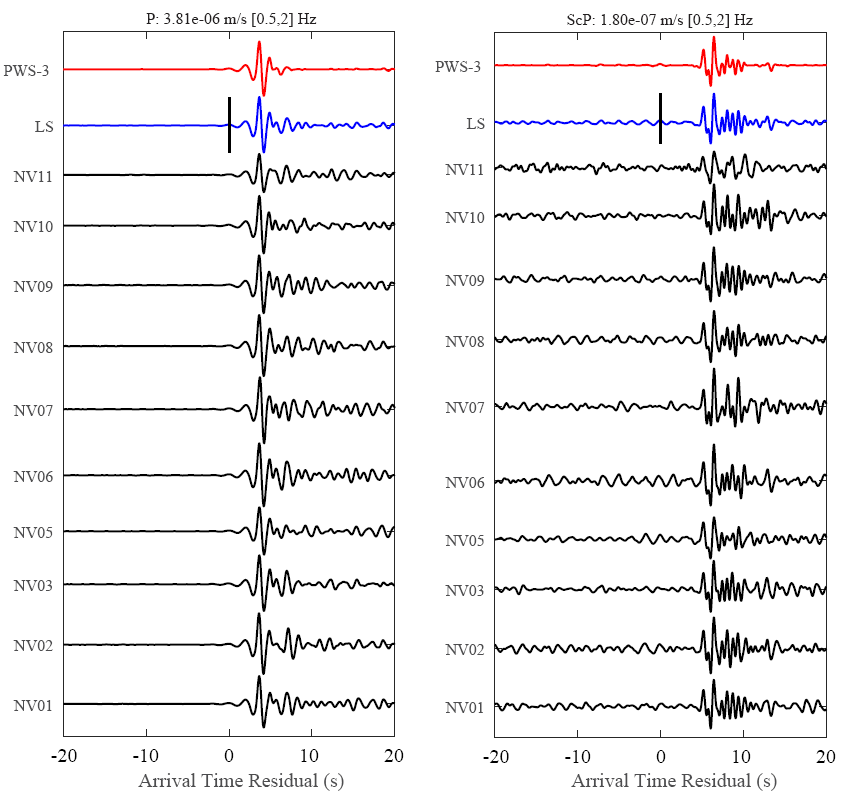
Some observations of a CRZ structure were also detected with ultra-low velocity zone (ULVZ) observations (Rost and Revenaugh 2003) → freely downloadable from Journal of Geophysical Research. The above two references are the only previous CRZ observations in the literature I am aware of.
References
Rost, S., and J. Revenaugh, 2001, Seismic Detection of Rigid Zones at the Top of the Core, Science, 294, no. 5548, 1911–1914, doi: 10.1126/science.1065617.
Rost, S., and J. Revenaugh, 2003, Small-scale ultralow-velocity zone structure imaged by ScP, Journal of Geophysical Research: Solid Earth, 108, no. B1, doi: 10.1029/2001JB001627.
Cal Poly Geology
Cal Poly offers a complete course of study in geology via the Geology Concentration of the Environmental Earth and Soil Science B.S. degree program. With the concentration in geology you will be able to pursue professional licensing and/or pursue graduate studies in geology and most any other area of the earth sciences.
The Geology Concentration has consistently satisfied the educational requirements needed for the Professional Geologist license in California.
The caveat is that the state agency in charge of licensing does not pre-approve programs. The educational background of each applicant is individually evaluated for eligibility to take the Fundamentals of Geology and Practice of Geology exams. This is true for all educational programs, not just Cal Poly's.
Please see the Cal Poly Geology wesbite for much more detailed information about the Professional Geologist licensing process.
Photo Albums
Course photo albums
➜ Field Geophysics (GEOL 420)
Fall 2025 Fall 2024 Fall 2023 Fall 2022 Fall 2021Fall 2020 Fall 2019 Fall 2018 Fall 2017 Fall 2016
Fall 2015 Fall 2014
➜ Seismology & Earth Structure (GEOL 305)
Spring 2024 Spring 2022 Winter 2020 Winter 2018Fall 2015
➜ Physical Geology Laboratory (GEOL 241)
Spring 2023 Spring 2021 Winter 2021 Spring 2019Spring 2018 Spring 2017
➜ Geologic Excursions (GEOL 206)
Winter 2024 Fall 2021 Spring 2019 Spring 2018Fall 2016